Infographics
One of the new skills I have learnt while attending the Digital Fluency Intensive programme here in Taipa is creating an infographic through google doc's. I never realised how more visually eye catching it is to read as opposed to the normal boring word document.
They can be used for posters, newsletters, visual aides....actually if you can think it, you can no doubt make it. I've discovered you just have to jump in and give things a go.
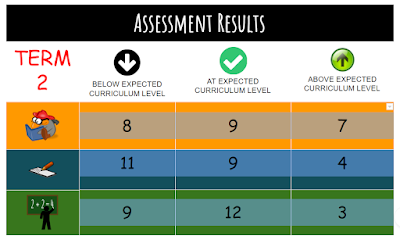
Here is an example of my first attempt.
Nga mihi to Dorothy Burt and Kerry Boyde-Preece.
Looking forward to next week's session.

Congratulations on this superb Graphic. How much better off we all would be (better engaged and better informed) if infographics were normalised. And for our children this would be so much better! I wonder if reporting to parents could be effectively done in this way?
ReplyDeleteDorothy
Kia ora Gaylene, Wow your blog is awesome, I love the way you've set out the learning from each day so far. Autaia koe!
ReplyDeleteGood Blog Gaylene, I like it.
ReplyDelete